
Restaurant Reporting Software: The Week’s Numbers, Explained, Every Monday
Restaurant AI Manager reports on stock, food and beverage cost, purchasing, sales and the menu for each venue and the whole group, from the orders, deliveries, invoices, counts and POS sales it already holds. Every Monday the week arrives in one email, and venues can be compared side by side. Each report exports to a spreadsheet, and the movement in GP is explained in dollars — price rises, mix, waste, yield and count error — that add up to the total.
- Stock, cost, purchasing, sales and menu reports
- Every venue on its own, or the group side by side
- Your week in one email, every Monday
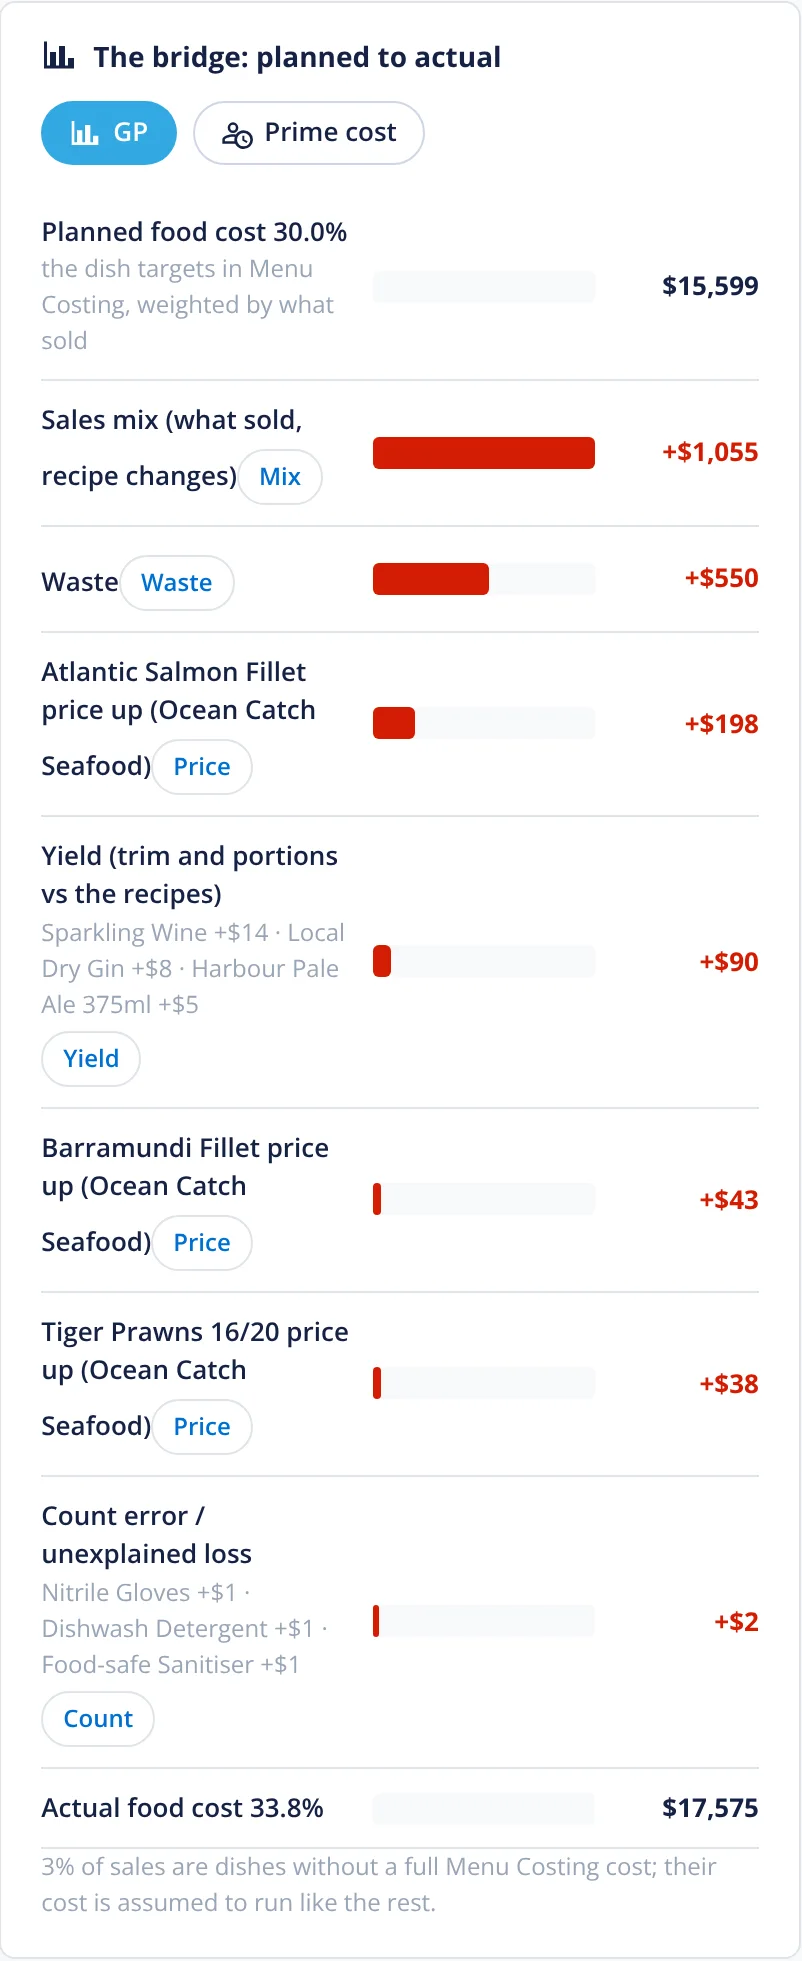
- GP movement explained in dollars that add up
Built on Open Pantry ordering — free, and used by 5,000+ venues
Recommended by:




The numbers arrive a month late, and they don’t say why
Food cost is one line in the accounts, three weeks after the month closed
Each venue sends its figures in its own spreadsheet
Nobody can tell a price rise from waste from a bad count
Purchases are checked against budget after the money is spent
Area managers read five reports to find one problem
The useful report is the one only the bookkeeper knows how to run
Reports that build themselves
The data is already there
Orders, deliveries checked off at the door, supplier invoices, stock counts, waste and transfers, and POS sales matched to your recipes. Nobody re-keys anything to get a report.
Pick a report, a venue and a period
Stock, cost, purchasing, sales and menu, labour and the production kitchen, for one venue, a region or the group, this week, last month or between two stock takes.
See what moved and why
Each figure can be tapped to see where it came from, and the movement in GP is split into price rises, mix, waste, yield and count error in dollars. Profit suggestions rank what to fix first.
Send it on
Every report exports to CSV or Excel. A weekly email lands every Monday with the venue’s week, and groups get a summary across every venue.
No sign-up — a demo restaurant group with a guide that shows you around
The report library
Stock reports cover stock on hand and its value, movements, theoretical against actual usage, variance by line, waste, transfers and stock-take history. Cost reports cover cost of goods between full counts, actual against theoretical food and beverage cost, recipe and menu GP and price changes. Purchasing reports cover spend by supplier, category, venue and person, budget against actual, approval times and off-list spend. Sales and menu reports cover product mix and menu engineering.
- Stock, cost, purchasing, sales and menu
- Per venue, per region or the whole group
- Every report exports to CSV or Excel
Purchases against budget while there is still time
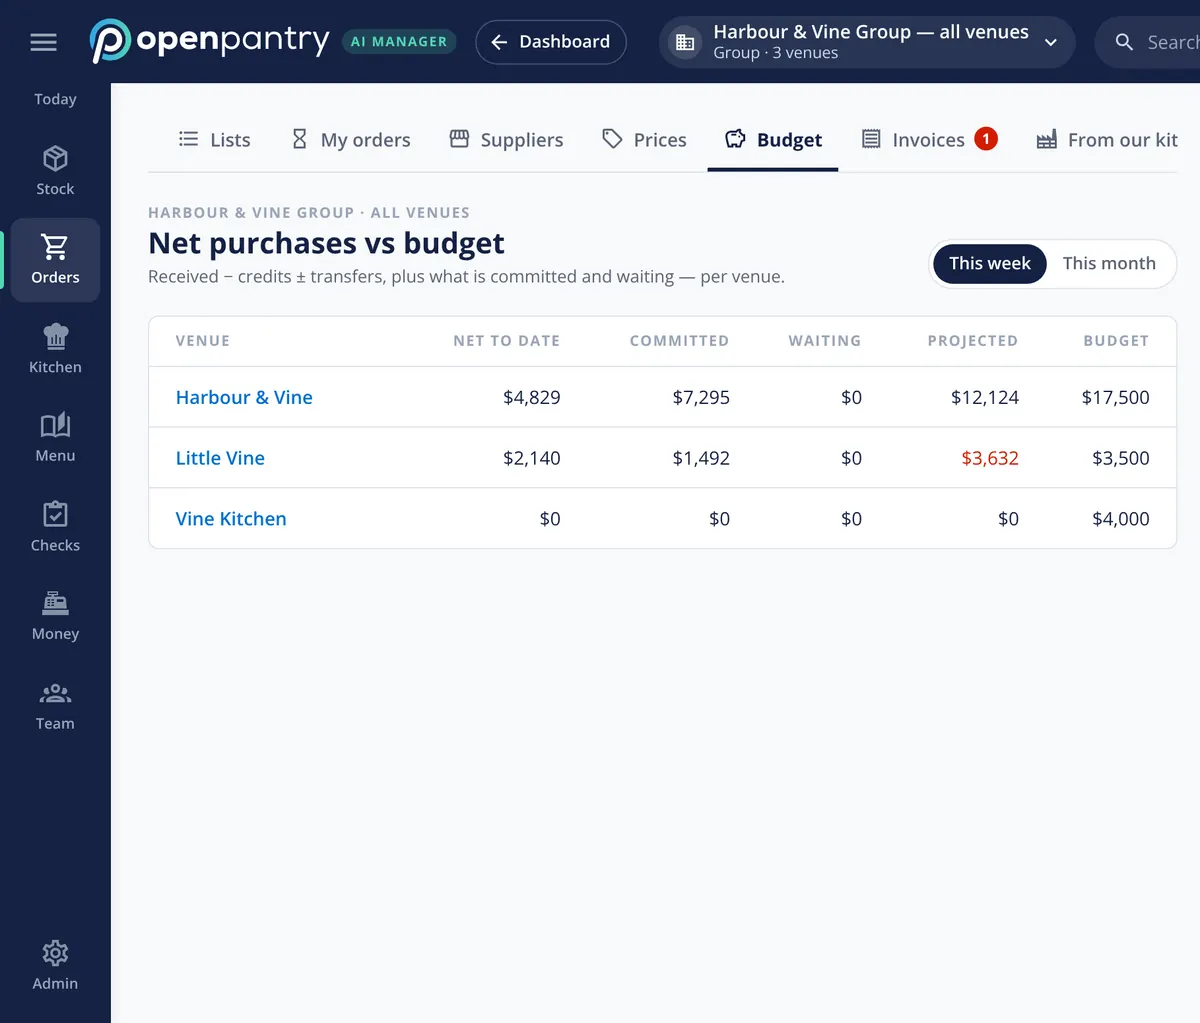
Net purchases — what was received, less credits, plus or minus transfers — are shown against each venue’s weekly budget, together with what is already committed with suppliers and what is waiting to be sent. A venue heading over budget shows in red mid-week, when an order can still be trimmed, and net purchases can be compared with what the sales forecast says food should have cost.
- Net to date, committed, waiting and projected
- This week or this month, per venue
- Net purchases against forecast cost
Your week in one email
The weekly email arrives every Monday morning with the venue’s week: sales, GP, purchases, waste and the things worth fixing first, each with a link straight to the screen behind it. Groups get a summary that ranks every venue side by side, so an area manager reads one email instead of five spreadsheets.
- Every Monday, per venue
- Group summary with venues side by side
- Each line links to the screen behind it
Ranked by what it is worth
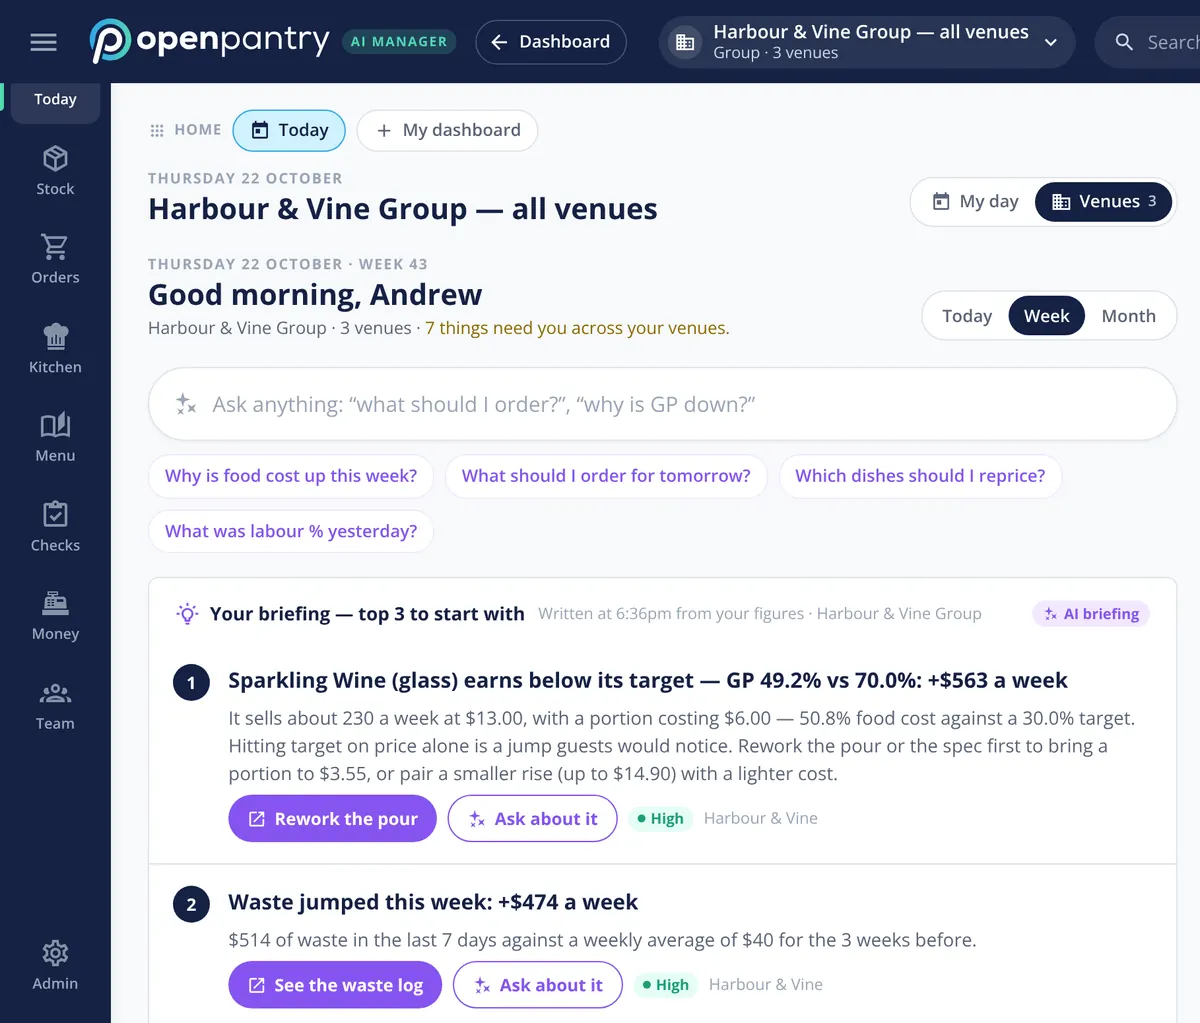
Profit suggestions turn the reports into a short list for each venue — a dish to reprice, a supplier rise to challenge, a par to change, a portion to fix — ranked by what each is worth a week, with the evidence one tap away and a draft ready to approve. The same ranking leads the morning briefing for every venue in the group. Owners can switch on more: Profit today, custom dashboards, a 4-4-5 or 13-period fiscal calendar, and a full data export.
- Ranked in dollars a week, per venue
- Evidence and a draft one tap away
- Profit today, custom dashboards and fiscal calendars as switches
What the reports are built from
Built by the team venues already order with
Chefs Love Open Pantry

Thank you OPEN PANTRY, we used to have to use 6 apps to get access to ordering from our suppliers, the fact we can do it all in one has saved an incredible amount of time & effort! We love you!

We’ve been using Open Pantry for a few months now and it’s been an absolute lifesaver. We’re short staffed so being able to place all of our orders with all of our suppliers in the one spot is a massive help.

So glad this service exists. Has made it so easy for my manager & chefs to order & all payments are settled in one go. The recurring orders & pantry lists are amazing time savers!!
Why not wait for the monthly P&L?
Because the P&L tells you what happened a month after you could have done anything about it, in one line per cost. Weekly reports built from the deliveries, counts and sales themselves show a price rise the week it starts, a waste problem while it is still one shift, and a venue going over budget before the order is sent. The accounts still close the month; the reports run the week.
Restaurant reporting — questions owners ask
What reports does Restaurant AI Manager include for a restaurant?+
Can I see every venue in the group side by side?+
Does it send a weekly report by email?+
Can I export the reports to Excel?+
How does it explain why my GP moved this week?+
Can I report in a 4-4-5 calendar or 13 periods instead of months?+
Does the reporting include labour and prime cost?+
Can I see the reports before I sign up?+
Works even better with
Open the reports of a demo restaurant group
Sign in as the owner of Harbour & Vine and run any report on real figures — no sign-up.
€65.04/month per venue billed yearly (save 20%) · or €81 month to month, no contract · plus tax