
Analytics & Reporting: Six Reports, Built From Orders You Already Took
Open Pantry’s Reporting section answers the questions a wholesale business actually asks: what did we sell and at what margin, which customers are growing and which have gone quiet, which products earn their shelf space, and how this period compares with the last. Nothing is assembled by hand — it reads the same orders your warehouse picked.
- Six reports: Overview, Customers, Products, Lapsed Purchases, Trends and Sales Team
- One date range drives every tab — 28 days out to 12 months, or your own dates
- Customers and Products export to a spreadsheet
★★★★★ Trusted by 600+ suppliers
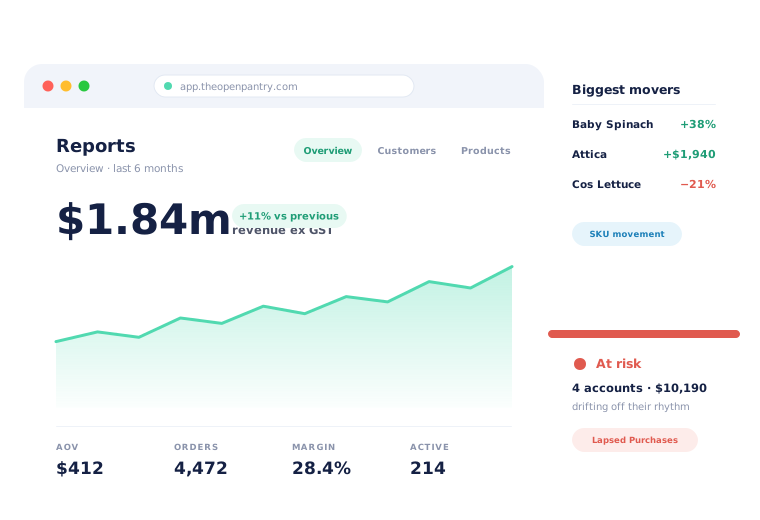



The numbers exist. Getting them into one place is the whole job.

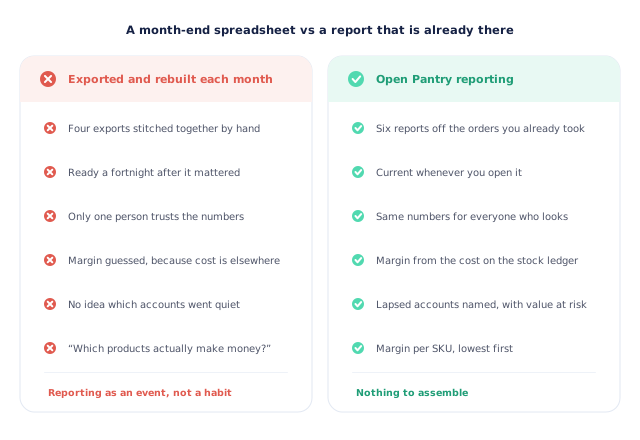
Four exports stitched together in a spreadsheet each month

Ready a fortnight after the month it describes

Margin guessed, because cost lives in a different system

Nobody notices an account went quiet until the quarter closes
Pick a Period, Then Read
Set the period once
One date control at the top of Reporting drives every tab — 28 days, 30 days, 60 days, 3, 6 or 12 months, or a custom range. Change it once and every report moves with it.
Start on Overview
Revenue excluding GST, average order value, order count, gross margin and active customers, with revenue over time, your sales mix by category and what you are owed.
Go to the tab that answers the question
Customers for account health, Products for what earns its place, Lapsed Purchases for what is slipping away, Trends for the comparison, Sales Team for the people.
Export what you need to share
The customer list, the opportunity list and both product exports come out as a spreadsheet you can send to a bookkeeper or a rep.
Free trial · Cancel anytime
Six reports, one date range
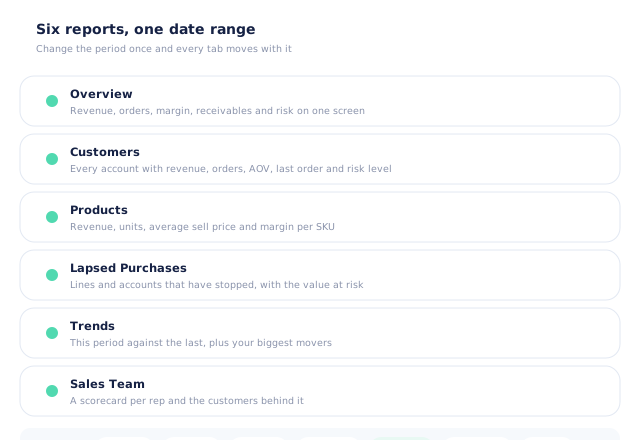
Reporting is not one dashboard with a hundred filters. It is six purpose-built views, each answering a question a wholesaler already asks out loud, and they all share a single period control so you are never comparing one report’s six months with another’s thirty days. That sounds small. It is the reason two people reading the same screen get the same number.
- Overview — revenue, orders, margin, receivables and risk in one place
- Customers, Products, Lapsed Purchases, Trends and Sales Team behind it
- One period control: 28 days to 12 months, or your own dates
- Everything derived from real orders, not from a separate data entry
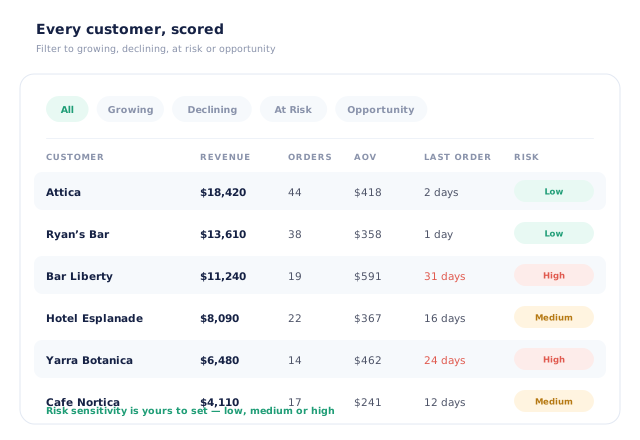
Every customer, scored — not just listed
The Customers report gives each account its revenue, order count, average order value, days since the last order and a risk level, and lets you filter to just the ones that are growing, declining, at risk, or represent an opportunity. How hard it judges is yours to set: a low sensitivity flags only the accounts that have clearly stopped, a high one catches a venue that is merely slowing. Open a row and you get that customer’s own sales, profit and cost over the period, their top products and their category mix.
- Revenue, orders, average order value, last order and risk level per account
- Filter to growing, declining, at risk or opportunity
- Risk sensitivity you set — low, medium or high
- Expand a customer for their sales, profit, cost and category mix
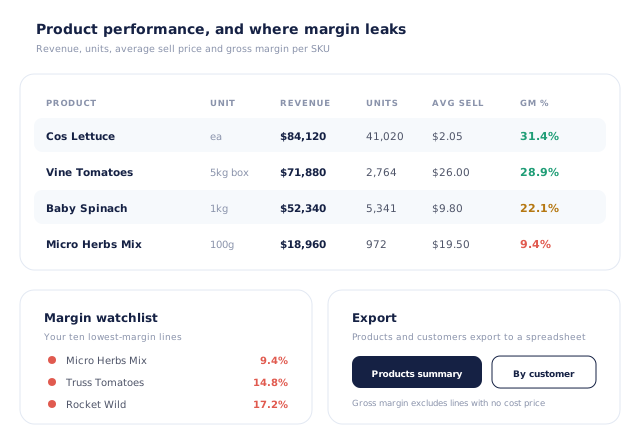
Which products earn their place — and where the margin leaks
The Products report shows revenue, units sold, average sell price and gross margin per SKU, filtered by category, with a margin watchlist that pulls your ten lowest-margin lines to the top. It is the report that ends arguments about a product that sells beautifully and makes nothing. One honesty note we would rather state than hide: gross margin is built from the cost recorded on your stock movements, so lines with no cost price sit outside it.
- Revenue, units, average sell price and gross margin per product
- Filter by category, and open a product for its own trend
- A margin watchlist of your ten lowest-margin lines
- Margin excludes products with no cost price — and says so on screen
What is slipping, and who should be doing something about it
Two reports exist for the money you have not lost yet. Lapsed Purchases watches the rhythm each customer has actually established, line by line, and flags what has stopped, slowed or shrunk with the monthly revenue at risk beside it — and lets you snooze, dismiss, annotate or mark something seasonal so the list stays trustworthy. Sales Team turns the same data into a scorecard per rep: accounts held, revenue against the previous period, at-risk count, opportunities and a book-health score, with the customers behind each number.
- Lapsed Purchases: stopped, slowing or reducing, with revenue at risk
- Snooze, dismiss, note or mark seasonal, so the list stays honest
- Per-rep scorecards with book health and the customers behind them
- Opportunities valued in dollars rather than flagged as a hunch
- More product lines purchased
- 24%
- Your always-on branded store and app put your full range in front of customers, so baskets grow.
- Less order-processing cost
- 95%
- AI order capture and auto-invoicing remove the manual keying between order and books.
- Fewer picking errors
- 80%
- Tablet pick & pack with FEFO lot and expiry tracking catches shorts and wrong items before they ship.
Real gains suppliers report after moving ordering, fulfilment and invoicing onto Open Pantry.
Reconciles With the Ledger You Already Run
Trusted by M&J Chickens
- $175m+
- Annual turnover
M&J Chickens use Open Pantry to move ordering out of calls and messages and into one digital workflow — giving customers a smooth ordering experience and giving the team fewer errors and less admin.
“With Open Pantry, we launched our own fully branded ordering app — it’s helped us protect our customer base, move to digital ordering, and deliver a much better experience to our venues.”

A report you have to build is a report you build twice a year.
Everyone means to review the numbers monthly. Almost nobody does, because the review starts with four exports and an afternoon, and by the time it is finished it describes a month you cannot change. Reporting that reads the orders directly removes the assembly step entirely — so the question moves from “can we get the numbers?” to “what are we going to do about them?”. That is also why the reports that matter most here are the forward-looking ones: an account that is slowing is still yours to keep.
Questions Suppliers Ask About Reporting
What reports does Open Pantry give a supplier?+
What date ranges can I report on?+
Can I export a report?+
Can I get reports emailed to me on a schedule?+
How does it calculate gross margin?+
How current are the numbers?+
How is this different from the margin and COGS page?+
Can I see which customers are about to stop ordering?+
Can every teammate see the reports?+
Which plan includes reporting?+
Works Even Better With
Stop Rebuilding the Same Spreadsheet.
Join 600+ Australian suppliers running their ordering, fulfilment and invoicing on Open Pantry.
Setup done for you · Cancel anytime · Your data stays yours