
Supplier Dashboard: One Screen That Tells You What Today Needs
Open Pantry’s dashboard does not open on a chart. It opens on the work that is outstanding — how many orders are waiting to be picked, how many are awaiting dispatch and how many of those are late, how many deliveries have not been invoiced, and whether anything failed to reach your accounting system — each with a count, a dollar value and an age. Under that sit the order funnel, stock health, accounts receivable and what is moving.
- To pick, awaiting dispatch, not invoiced, accounting export — count, value and age
- A six-stage order funnel paced against the same weekday last week
- Accounts receivable, stock health, SKU movers, top customers and cross-sell gaps
★★★★★ Trusted by 600+ suppliers
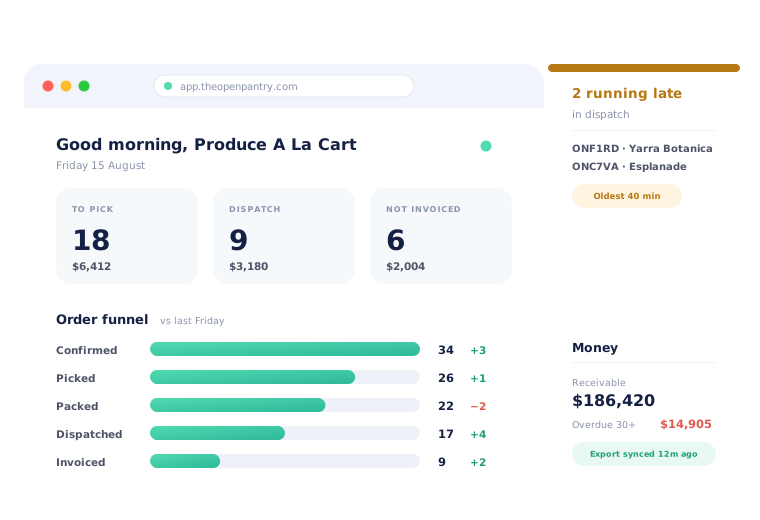



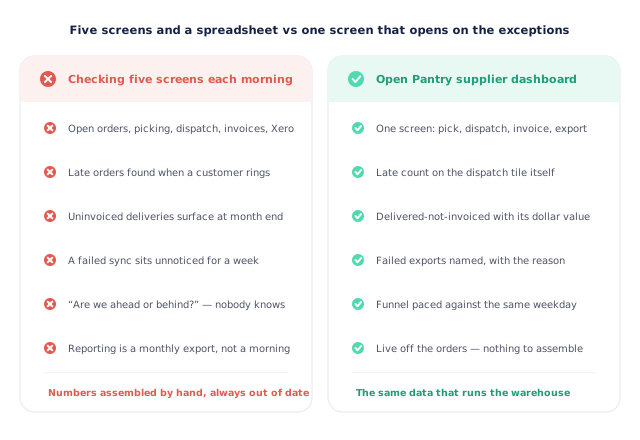
You can only see how the day is going by opening five screens.

Orders running late are found out when the customer rings

Deliveries that were never invoiced surface at month end

A failed accounting sync sits unnoticed for a week

Nobody can say whether today is ahead of or behind last week
Open It at 6am and Know Where You Stand
Start with what is outstanding
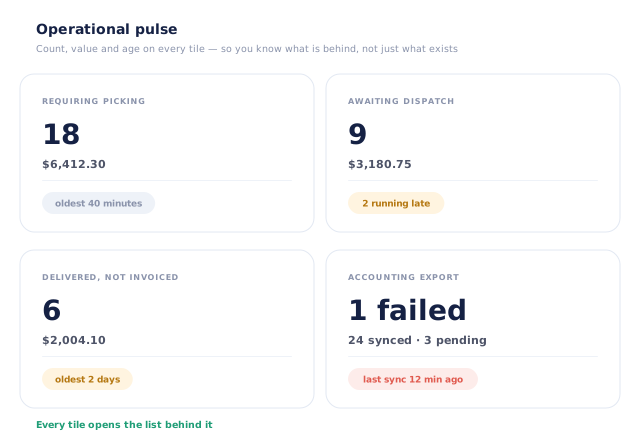
Four tiles at the top: requiring picking, awaiting dispatch, delivered but not invoiced, and accounting export. Each carries a count, the dollar value behind it and how old the oldest one is.
Read the funnel
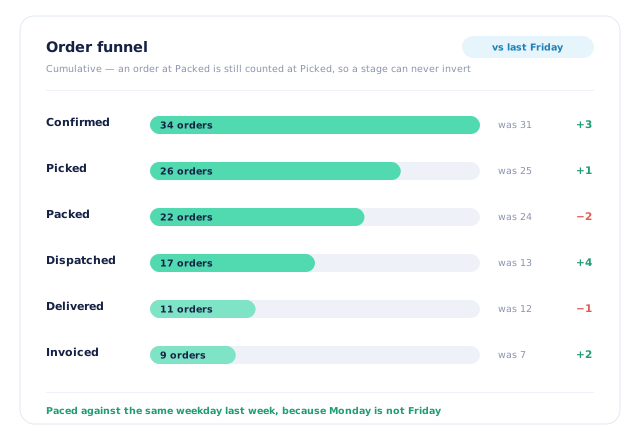
Six cumulative stages from confirmed through to invoiced, with today measured against the same weekday last week — so “34 confirmed” means something rather than being a number on its own.
Check the money
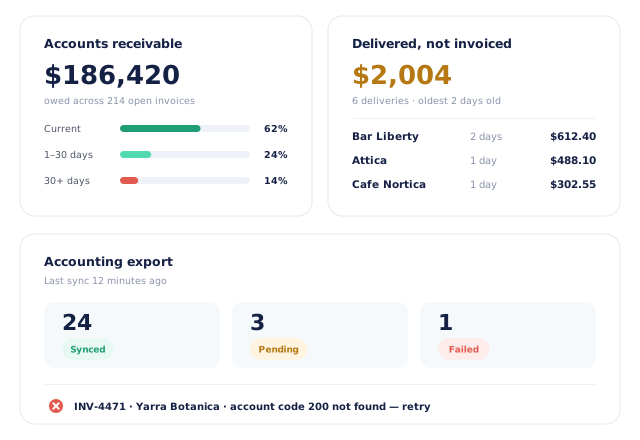
Accounts receivable with its ageing, the value of deliveries not yet invoiced, and the state of your accounting export: how many synced, how many pending, how many failed and when the last sync ran.
See what is moving
Your fastest-growing and steepest-declining SKU, your biggest customer mover, top customers, revenue by product category, and the cross-sell gaps worth chasing.
Free trial · Cancel anytime
The operational pulse: count, value and age on every tile
A count on its own is not information. Eighteen orders to pick is fine at 6am and a problem at 11am, and it matters a great deal whether those eighteen are worth six hundred dollars or six thousand. So every tile carries three things: how many, how much, and how old the oldest one is. The dispatch tile carries a fourth — how many of those orders are already running late.
- Requiring picking — count, value, age of the oldest
- Awaiting dispatch — with the number already running late called out
- Delivered but not invoiced — the revenue you have earned and not billed
- Accounting export — pending, synced, failed, and when it last ran
The order funnel, paced against the same weekday last week
The funnel shows the whole day’s work in six stages — confirmed, picked, packed, dispatched, delivered, invoiced — and compares each one with the same weekday a week ago, because Monday is not Friday and comparing them tells you nothing. The stages are cumulative: an order that is packed is still counted as picked. That sounds like a technicality, and it is the reason the funnel can never show you a later stage running ahead of an earlier one and leave you wondering which number to believe.
- Six stages: confirmed, picked, packed, dispatched, delivered, invoiced
- Cumulative, so the shape of the funnel is always readable
- Compared with the same weekday last week, not with yesterday
- Built from the same records the warehouse is working from
The money view: owed, unbilled, and anything that failed to export
Three numbers decide whether a wholesale week was a good one, and none of them is revenue. What you are owed and how old it is. What you have delivered and not yet billed. And whether the invoices you did raise actually reached your accounting system. The dashboard puts all three on one screen, with the failed exports named individually and the reason attached, so a broken account code is a five-minute fix rather than a reconciliation at month end.
- Accounts receivable with its ageing across current, 1–30 and 30+ days
- Delivered but not invoiced, in dollars, oldest first
- Accounting export status — synced, pending, failed, last sync time
- Low stock and out of stock counts alongside, from your own trigger levels
What is moving, and what is quietly not
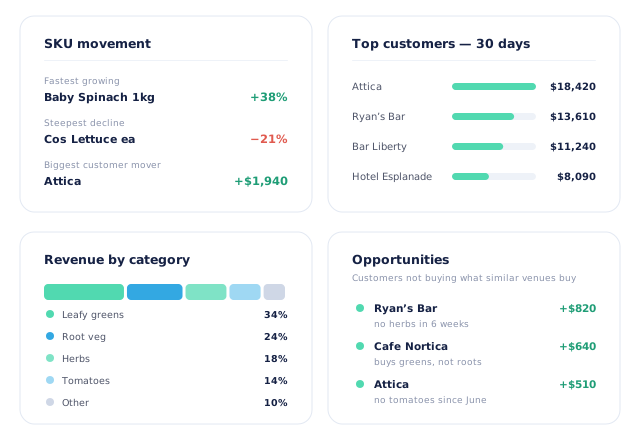
Underneath the operational view, the dashboard reads the trade itself: the SKU growing fastest and the one falling away, the customer whose spend has moved most, your top customers over the period, and how revenue splits across your product categories. Alongside them sit opportunities — customers buying one part of your range and not another, with the value of the gap attached. It is the difference between knowing what happened and knowing what to do about it.
- Fastest-growing and steepest-declining SKU
- Biggest customer mover, up or down
- Top customers and revenue by product category
- Cross-sell opportunities, valued rather than just flagged
- More product lines purchased
- 24%
- Your always-on branded store and app put your full range in front of customers, so baskets grow.
- Less order-processing cost
- 95%
- AI order capture and auto-invoicing remove the manual keying between order and books.
- Fewer picking errors
- 80%
- Tablet pick & pack with FEFO lot and expiry tracking catches shorts and wrong items before they ship.
Real gains suppliers report after moving ordering, fulfilment and invoicing onto Open Pantry.
Reading From the Ledger You Already Use
Trusted by M&J Chickens
- $175m+
- Annual turnover
M&J Chickens use Open Pantry to move ordering out of calls and messages and into one digital workflow — giving customers a smooth ordering experience and giving the team fewer errors and less admin.
“With Open Pantry, we launched our own fully branded ordering app — it’s helped us protect our customer base, move to digital ordering, and deliver a much better experience to our venues.”

A dashboard you have to assemble is a report, and it is already out of date.
Most wholesale dashboards are a spreadsheet somebody rebuilds on Monday from four exports. By the time it is finished it describes last week, it cannot tell you that nine orders are sitting in dispatch right now, and the person who built it is the only one who trusts it. A dashboard that reads the same records the warehouse is picking from does not need assembling and cannot be stale — and because it starts from what is outstanding rather than from what is finished, it is useful at six in the morning rather than at the end of the month.
Questions Suppliers Ask About the Dashboard
What is supplier dashboard software?+
What is actually on the Open Pantry dashboard?+
How current are the numbers?+
Why is the funnel cumulative?+
What does the pace comparison compare against?+
Does it tell me if an invoice failed to reach my accounting system?+
Can it show me which customers are worth chasing?+
Is a dashboard useful for a small supplier?+
How is this different from the reports section?+
Which plan includes the dashboard?+
Works Even Better With
Margin & COGS Analytics
What the day was actually worth, once cost of goods is taken out.
Explore →Inventory Intelligence
The stock levels and trigger points behind the dashboard’s low-stock count.
Explore →Digital Pick & Pack
The picking and packing that moves orders through the funnel in the first place.
Explore →Know Where the Day Stands Before the Phone Rings.
Join 600+ Australian suppliers running their ordering, fulfilment and invoicing on Open Pantry.
Setup done for you · Cancel anytime · Your data stays yours