
Reporting & Profit Insights: Know Which Dish Stopped Making Money
Every dish carries a live cost percentage built from what you actually paid for its ingredients, so when a supplier price moves, the margin moves with it — and the dishes pushed past their food-cost target arrive as a short list to reprice rather than a surprise in the quarterly accounts. Alongside that sit food and beverage cost against target, dish margins ranked, and sales, profit and cost against the previous period.
- A cost percentage and trend on every dish
- Dishes past their food-cost target listed, ready to reprice
- Food cost, beverage cost and average dish margin against target
- Sales, profit and cost against the previous period
★★★★★ Trusted by 5,000+ venues across Australia
Recommended by:




By the time the accounts say it, the quarter is gone
Food cost is a number you see months in arrears
Dish prices were set once, against costs that have since moved
A supplier price rise quietly eats a margin nobody is watching
The busiest dish and the most profitable dish are assumed to be the same
Nobody can name the ingredient behind a cost increase
Reporting means exporting to a spreadsheet and rebuilding it by hand
From what you paid to what you should charge
Recipes cost themselves
Each dish is built from ingredients you actually buy, so its cost comes from your real prices rather than a figure typed in once. Sub-recipes roll up into the dishes that use them.
Costs move when your suppliers move
When an ingredient price changes, the dishes using it recost. The board shows each dish’s cost percentage with the movement since last time, so a change is visible as a direction, not just a number.
The board tells you what needs attention
Dishes pushed past their food-cost target are counted in a banner with a link into the repricing queue, and the dashboard ranks dish margins into top earners and the ones needing attention.
Then check it against the takings
With sales in, the reports show sales, profit and cost for the period against the one before, broken down by menu with a cost-of-goods percentage per category, and down to menu item and product.
See how Open Pantry works for venues
A cost percentage on every dish, kept current
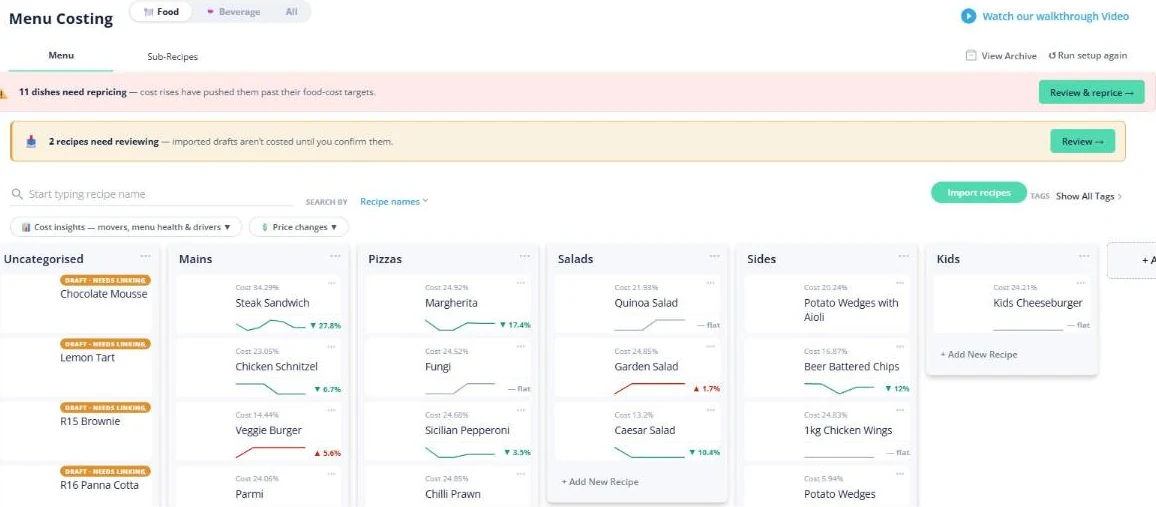
The menu board shows your dishes grouped the way the menu is, and each one carries its cost percentage, a small trend line and the movement since last time — down 27.8%, up 5.6%, or flat. Because the figure is built from ingredient prices rather than typed in, the board tells you what the menu costs today and not what it cost when someone last did the maths.
- Cost percentage and trend per dish
- Movement shown as a direction, not just a value
- Food and beverage sides of the menu kept separate
The dishes that need repricing, counted for you
The useful output of costing is not a report, it is a short list. A banner on the board says how many dishes cost rises have pushed past their food-cost targets and links into the repricing queue, and the dashboard names the ones below target margin outright. Imported recipes that are not costed yet are flagged separately so they cannot quietly skew the picture.
- Count of dishes past their food-cost target
- Straight into a repricing queue
- Uncosted draft recipes flagged rather than averaged in
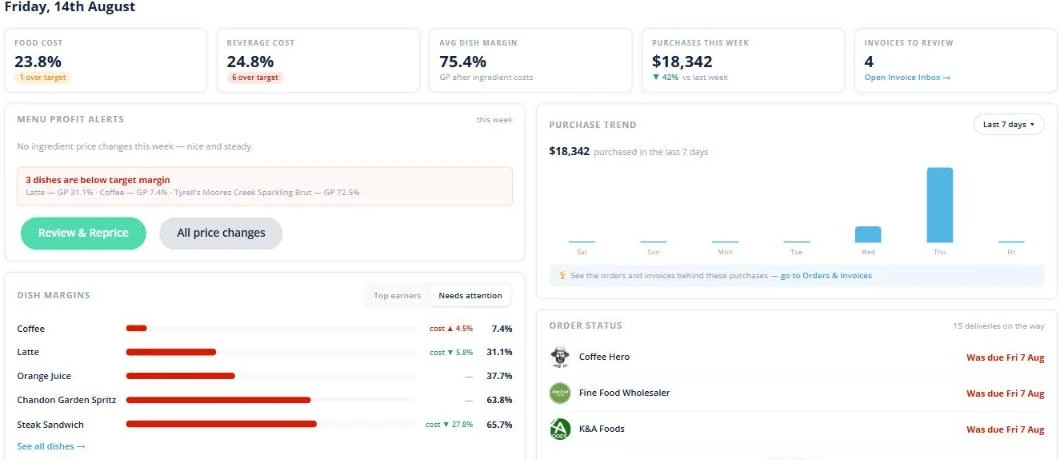
Food cost, beverage cost and margin against target
The dashboard leads with the three numbers a venue is actually judged on: food cost percentage, beverage cost percentage and average dish margin as gross profit after ingredient costs — each shown against your target, with a count of how many dishes are over it. Dish margins are then ranked into top earners and the ones needing attention, with the cost movement beside each.
- Food and beverage cost percentage against target
- Average dish margin as GP after ingredient costs
- Dish margins ranked, with cost movement per dish

Sales, profit and cost against last period
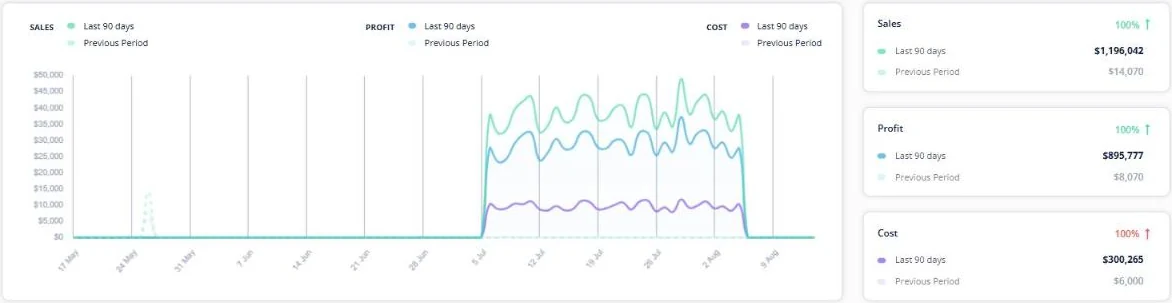
Once sales are in, the reports put sales, profit and cost for your chosen period against the equivalent period before — today, a week, 28, 30, 60 or 90 days, months, all time or a custom range. The menu breakdown carries a cost-of-goods percentage per category with item counts and totals, and there are separate views by menu item and by product.
- Sales, profit and cost against the previous period
- COGS percentage per menu category
- Down to menu item and individual product, and exportable
Fits how the venue already works
Venues that repriced in time
Chefs Love Open Pantry

Thank you OPEN PANTRY, we used to have to use 6 apps to get access to ordering from our suppliers, the fact we can do it all in one has saved an incredible amount of time & effort! We love you!

We’ve been using Open Pantry for a few months now and it’s been an absolute lifesaver. We’re short staffed so being able to place all of our orders with all of our suppliers in the one spot is a massive help.

So glad this service exists. Has made it so easy for my manager & chefs to order & all payments are settled in one go. The recurring orders & pantry lists are amazing time savers!!
Why not just check the numbers at the end of the quarter?
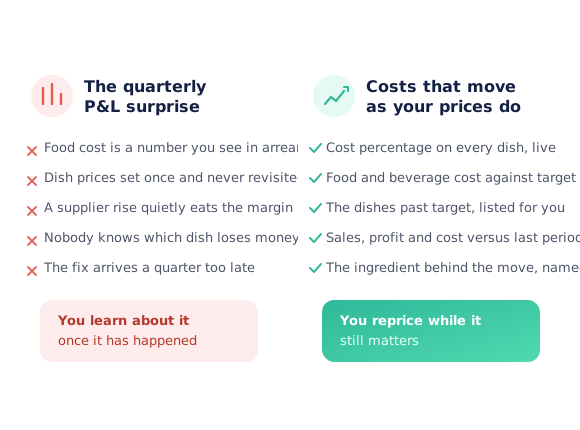
Because by then the only thing left to do is regret it. A quarterly food-cost figure tells you that margin was lost; it cannot tell you which dish lost it or which ingredient moved, so the response is a blunt one — put prices up, or cut portions. Costing dishes off live ingredient prices makes the same information arrive as a handful of dishes to look at this week, while repricing one of them is still a small decision.
Open Pantry for restaurants in Australia
Australian restaurants, cafés and pubs use Open Pantry to order from all their suppliers in one place and keep food costs in view.
- Plans priced in
- AUD — see Australia pricing
- Accounting sync
- Xero, MYOB and QuickBooks Online
- Supplier directory
- 1,100+ Australian wholesale food & beverage suppliers
Can restaurants in Australia use Open Pantry?
Yes. Restaurants, cafés and pubs in Australia use Open Pantry to order from all their suppliers in one place, track what they buy and keep food costs in view. Paid plans are priced in AUD.
Is ordering on Open Pantry free for restaurants?
Yes. The ordering package is free, with unlimited suppliers and orders. Paid plans add menu costing, inventory and reporting, and are priced in AUD.
Reporting and profit insights — questions venues ask
How does Open Pantry work out what a dish costs?+
What happens when an ingredient price goes up?+
Can I see which dishes are least profitable?+
What reports are there beyond dish costs?+
What periods can I report over?+
Do I need to enter sales for this to be useful?+
Does it tell me what to charge for a dish?+
What about recipes we imported but have not finished?+
Is profit reporting included with ordering?+
Works even better with
Sales & Waste Tracking
The sales and write-offs these margins are calculated from.
Explore →Products Purchased & Purchase History
The prices behind every dish cost, and how they have moved.
Explore →Restaurant Inventory Management
On-hand balances and par levels behind the numbers.
Explore →Food Costing Software
Every recipe costed off the supplier prices you actually pay, re-costed when they move.
Explore →Find the dish that stopped paying for itself
Menu costing and profit reporting are part of Menu Profit Manager.
Free to order · Paid plans include a free trial · Cancel anytime