
Margin & COGS Analytics: Your Real Margins, By Product and By Customer, Live
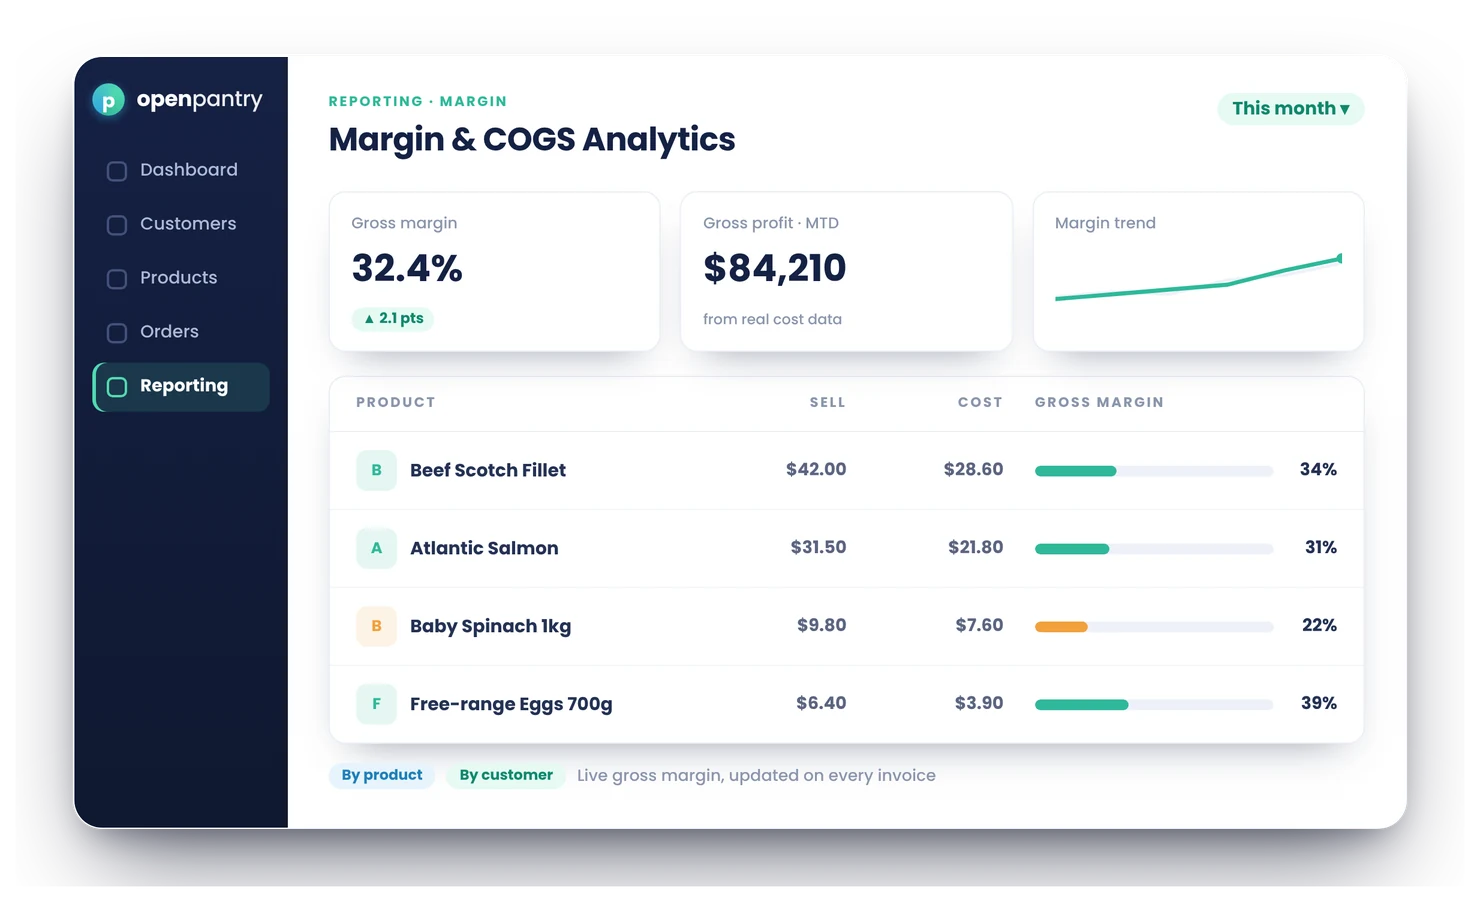
Margin & COGS analytics show your actual gross margin on every product and every customer, calculated from real cost data — what you genuinely paid for the stock that shipped, not a cost estimate from last quarter. You see where you make money and where you quietly lose it, while there’s still time to fix it.
- Gross margin by product and by customer, from realised costs
- Cost changes flow through automatically as vendor invoices land
- Spot loss-making lines and underpriced customers before month end
★★★★★ Trusted by 600+ suppliers across Australia



Most wholesalers are guessing their margins

Margins calculated on last quarter’s costs while this week’s prices moved again

A “good customer” on pricing agreed two years ago — now unprofitable, invisibly

Products selling at a loss discovered at stocktake, or never

Your P&L says one number; nobody can say which products or customers produced it
Real Costs In, Real Margins Out
Costs come from reality
Vendor invoices, lot-level stock costs and accepted cost updates feed actual product costs.
Sales meet costs
Every order line pairs the price charged with the realised cost of the stock that shipped.
Margins compute live
Dashboards show gross margin by product, by customer and over time — consistently, from one ledger of truth.
You act early
Reprice the loss-maker, renegotiate the stale deal, feature the high-margin line — in week one, not at month end.
Free trial · Cancel anytime
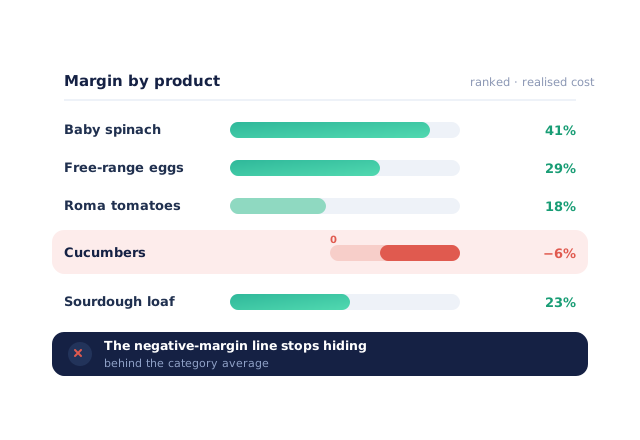
Margin by product
Every line ranked by what it actually earns. The cucumber that’s secretly negative-margin stops hiding behind the category average.
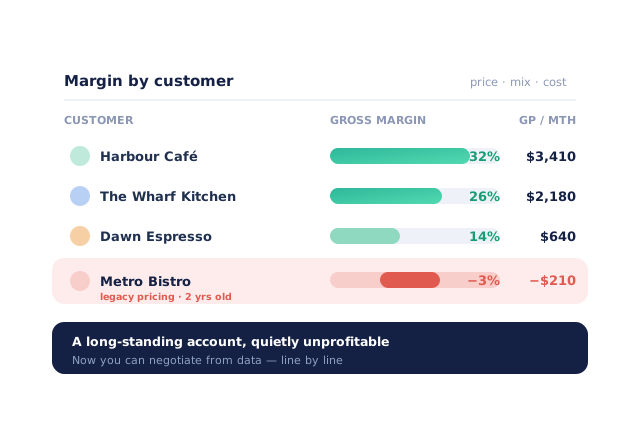
Margin by customer
Distributor research consistently finds a large share of customers are unprofitable once measured properly. See each account’s real gross margin — volume, pricing and mix combined — and negotiate from data.
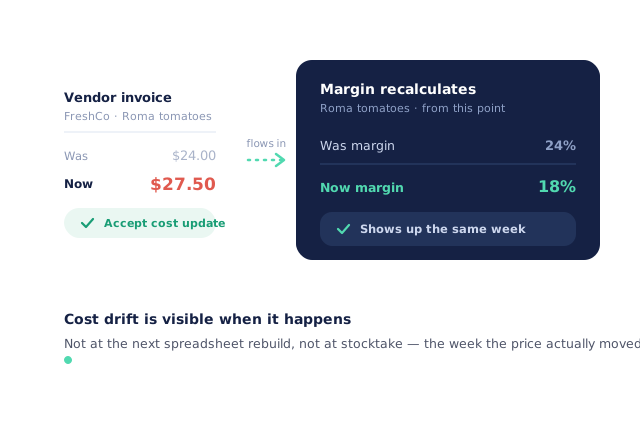
Costs that update themselves
When a vendor invoice lands at a new price and you accept the cost update, margins recalculate from that point. Cost drift shows up in your dashboards the week it happens.
Lot-accurate COGS
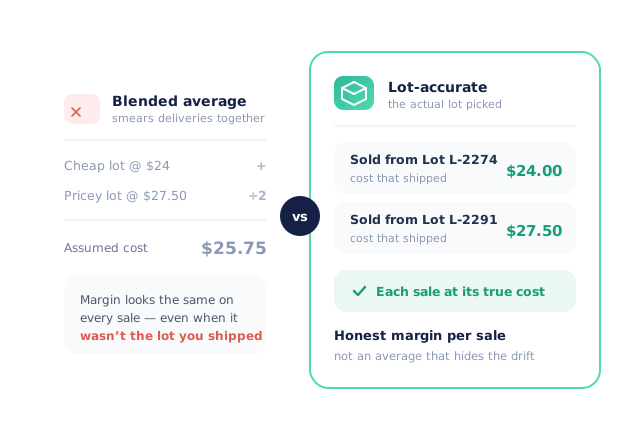
With lot tracking on, COGS reflects the actual cost of the specific lot picked — not an average that smears expensive and cheap deliveries together.
- More product lines purchased
- 24%
- Your always-on branded store and app put your full range in front of customers, so baskets grow.
- Less order-processing cost
- 95%
- AI order capture and auto-invoicing remove the manual keying between order and books.
- Fewer picking errors
- 80%
- Tablet pick & pack with FEFO lot and expiry tracking catches shorts and wrong items before they ship.
Real gains suppliers report after moving ordering, fulfilment and invoicing onto Open Pantry.
Consistent Margin Numbers Across Your Platform
Trusted by M&J Chickens
- $175m+
- Annual turnover
M&J Chickens use Open Pantry to move ordering out of calls and messages and into one digital workflow — giving customers a smooth ordering experience and giving the team fewer errors and less admin.
“With Open Pantry, we launched our own fully branded ordering app — it’s helped us protect our customer base, move to digital ordering, and deliver a much better experience to our venues.”

Margin tools are only as honest as their cost data
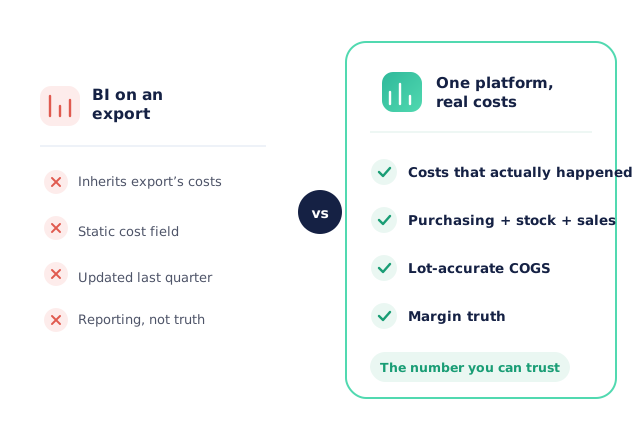
A BI dashboard bolted onto exported data inherits whatever cost assumptions the export made — usually a static cost field someone updated last quarter. Because Open Pantry runs your purchasing, stock and sales in one platform, the margin maths uses the costs that actually happened. That’s the difference between margin reporting and margin truth.
Open Pantry for food suppliers in Australia
Australian food and beverage wholesalers use Open Pantry to take orders from restaurants, cafés and venues online, with every order flowing to picking, invoicing and accounting.
- Plans priced in
- AUD — see Australia pricing
- Accounting sync
- Xero, MYOB and QuickBooks Online
- Supplier directory
- 1,100+ Australian wholesale food & beverage suppliers
Can Australian food suppliers use Open Pantry?
Yes. Wholesalers and distributors in Australia use Open Pantry to take orders from restaurants, cafés and venues through their own branded ordering app and online store. Plans are priced in AUD, and orders and invoices sync with Xero, MYOB and QuickBooks Online.
Is there a free plan for suppliers in Australia?
Yes. The free plan lets you list products and receive unlimited orders. Paid plans add accounting, inventory and delivery tools, come with a free trial and are priced in AUD.
Questions Suppliers Ask About Margin & COGS Analytics
How do I calculate gross margin for a wholesale food business?+
What’s a good gross margin for a food wholesaler?+
What’s the difference between markup and margin?+
How do I know which customers are actually profitable?+
Should margin use last cost, average cost, or actual lot cost?+
Does margin data update when my buy prices change?+
Why might my margin report differ from my accountant’s P&L?+
Can I see margin by product and by customer at the same time?+
How do I spot products losing money before month end?+
What should I do about a big customer on prices that no longer cover costs?+
Where does the cost data come from?+
Which plan includes margin analytics?+
Works Even Better With
Vendor Invoice Matching
Accepted cost updates from vendor invoices feed accurate, current COGS.
Explore →Inventory Intelligence
Stock, sales and cost data in one place power honest margin numbers.
Explore →Customer Pricing & Promotions
See price, margin and profit together before you set or change a price.
Explore →See Where You Actually Make Money.
Join 600+ Australian suppliers running their ordering, fulfilment and invoicing on Open Pantry.
Setup done for you · Cancel anytime · Your data stays yours