


The reporting suite
Quick answer: The reporting suite shows revenue over time, sales mix, accounts receivable, customer and product performance and risk signals across your business.
The Reporting suite is where you see how your business is performing — sales, customers, products and the signals that tell you where to focus. Open it from the main navigation under Reporting; it lives at /tools/reporting.
Across the top you'll find tabs for the different views, and a date-range selector that applies to whichever tab you're on.
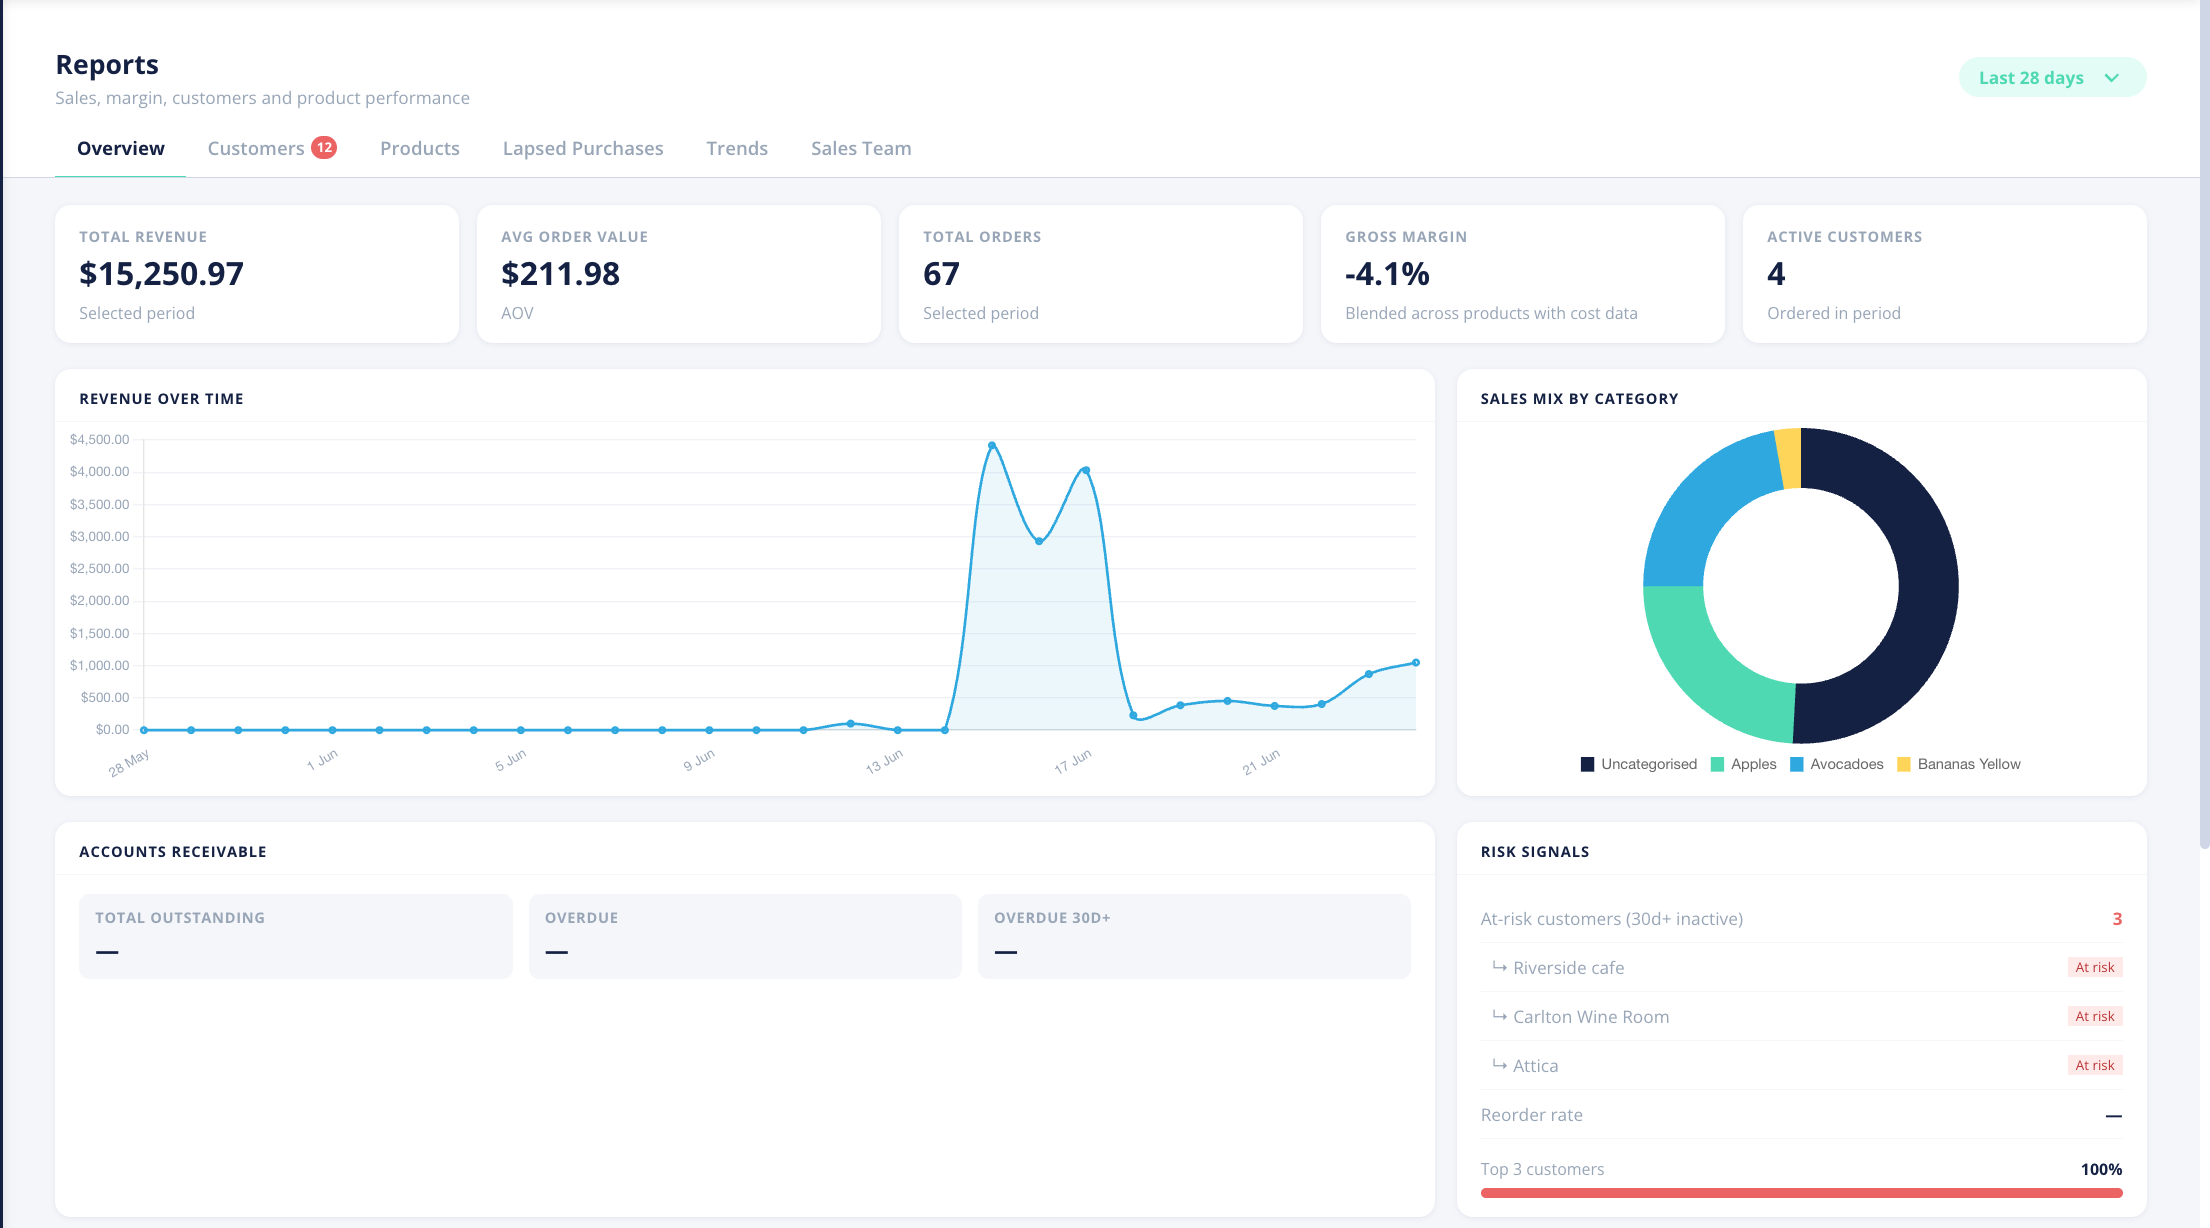
Overview
Your headline numbers and charts in one place:
- KPIs — Total Revenue, Average Order Value, Total Orders, Gross Margin and Active Customers.
- Revenue over time — how your sales are trending across the chosen date range.
- Sales mix by category — which product categories make up your sales.
- Accounts receivable — Total outstanding, Overdue and Overdue 30 days or more.
- Risk signals — At-risk customers (30+ days inactive) and your Reorder rate.
- Top customers and Top products — your best performers for the period.
Customers
A customer-by-customer view of performance, with filters that flag who needs attention — for example At Risk (customers who've gone quiet), Opportunity (room to grow), and Growing or Declining (momentum). See the Customer Overview & Risk Level article for more on how risk is worked out.
Products
How your products are selling — useful for spotting your strongest lines and the ones slipping.
Lapsed Purchases
Highlights products a customer used to buy regularly but has stopped buying — a practical prompt for a reorder conversation. It uses a smart expectancy model to tell the difference between a genuine drop-off and normal irregular buying.
Trends
Longer-run movement in your numbers, so you can see the direction of travel rather than a single snapshot.
Sales Team
A scorecard view of performance by sales rep — helpful if you have people managing accounts.
How do I choose a date range?
Use the date-range selector at the top to set the period you want to look at. It applies to the tab you're viewing, so you can compare like-for-like across the suite.
Note: Some reporting and export features may depend on your plan. If a report or download isn't available on your account, it may be a paid feature — contact the Open Pantry team.